About

Sensafety

What's Sensafety about?

The Sensafety initiative enables citizen scientists to quickly and easily capture the perceived safety in public spaces via an app and to experience the statistical results immediately on an interactive map.

Subjective indicators of urban quality of life, such as the feeling of safety or the perception of a threat, can only be quantitatively collected to a limited extent due to their high dependence on the location and situation on site. The aim of the Sensafety initiative is to capture the urban feeling of safety in-situ, across all age groups, area-wide and at different times of day, using an app, and to make the statistical results available to the citizen scientists and research partners. With the collected data, anxiety spaces or traffic-related problem zones in public space can be identified, investigated in detail and made more liveable through safety measures or urban planning changes.

How do citizens participate?

Citizen scientists download the Sensafety app for iOS or Android, install it, and immediately start to capture the perceived safety on site. The collection of the data is carried out in compliance with data protection regulations and neither registration nor the entry of personal data is required.

The quick and uncomplicated capturing of the perceived safety is conducted by answering the question "Do you feel safe at your location right now?" either affirmatively or negatively. After the rating, citizen scientists will be asked to select from a list of location-specific reasons for their personal assessment in case the place is under investigation by a local research partner.

What happens with the results?

The data collected is statistically evaluated in a continuous manner and made publicly available in aggregated form on an interactive map within the app and on the website.

Interested research groups, e.g. at universities, research institutes, from research associations or departments, are invited to participate in Sensafety or to use Sensafety for their local research purposes. As a local research partner, they are granted access to the anonymized ratings in raw format (incl. position and timestamp of the rating) for a specific area. Moreover, local research partners are able specify the list of location-specific reasons which a citizen scientist selects from during the rating process within the app. For more details, click here.

What's the research contribution?

The perceived safety in public spaces has a significant influence on the urban quality of life. The causes for a reduced urban sense of safety are manifold and range from insufficiently secured and marked bicycle paths, insufficiently lit and poorly maintained sidewalks, to hardly visible and little frequented alleys, underpasses or parking lots.

The aim of the Sensafety initiative is to make visible and map urban anxiety areas and problem zones that are not identifiable as such due to a low local crime rate and an insignificant number of reported accidents, and to document the development of these before and after urban changes. The data collected will be made available to research partners from different research disciplines, such as urban planning and sociology, in anonymized form for further research purposes.

For Researchers

Can I use Sensafety in my research project?

The collected data can significantly advance research in areas such as urban science, urban sociology and citizen participation. We therefore invite research groups from all over the world to become local research partners of the Sensafety initiative. A local research partner gets access to the anonymized ratings of within a specific area of investigation. If desired, a local research partner is - in addition - able to set up arbitrary extended safety polls for the area of investigation. Giving the poll results more meaning.

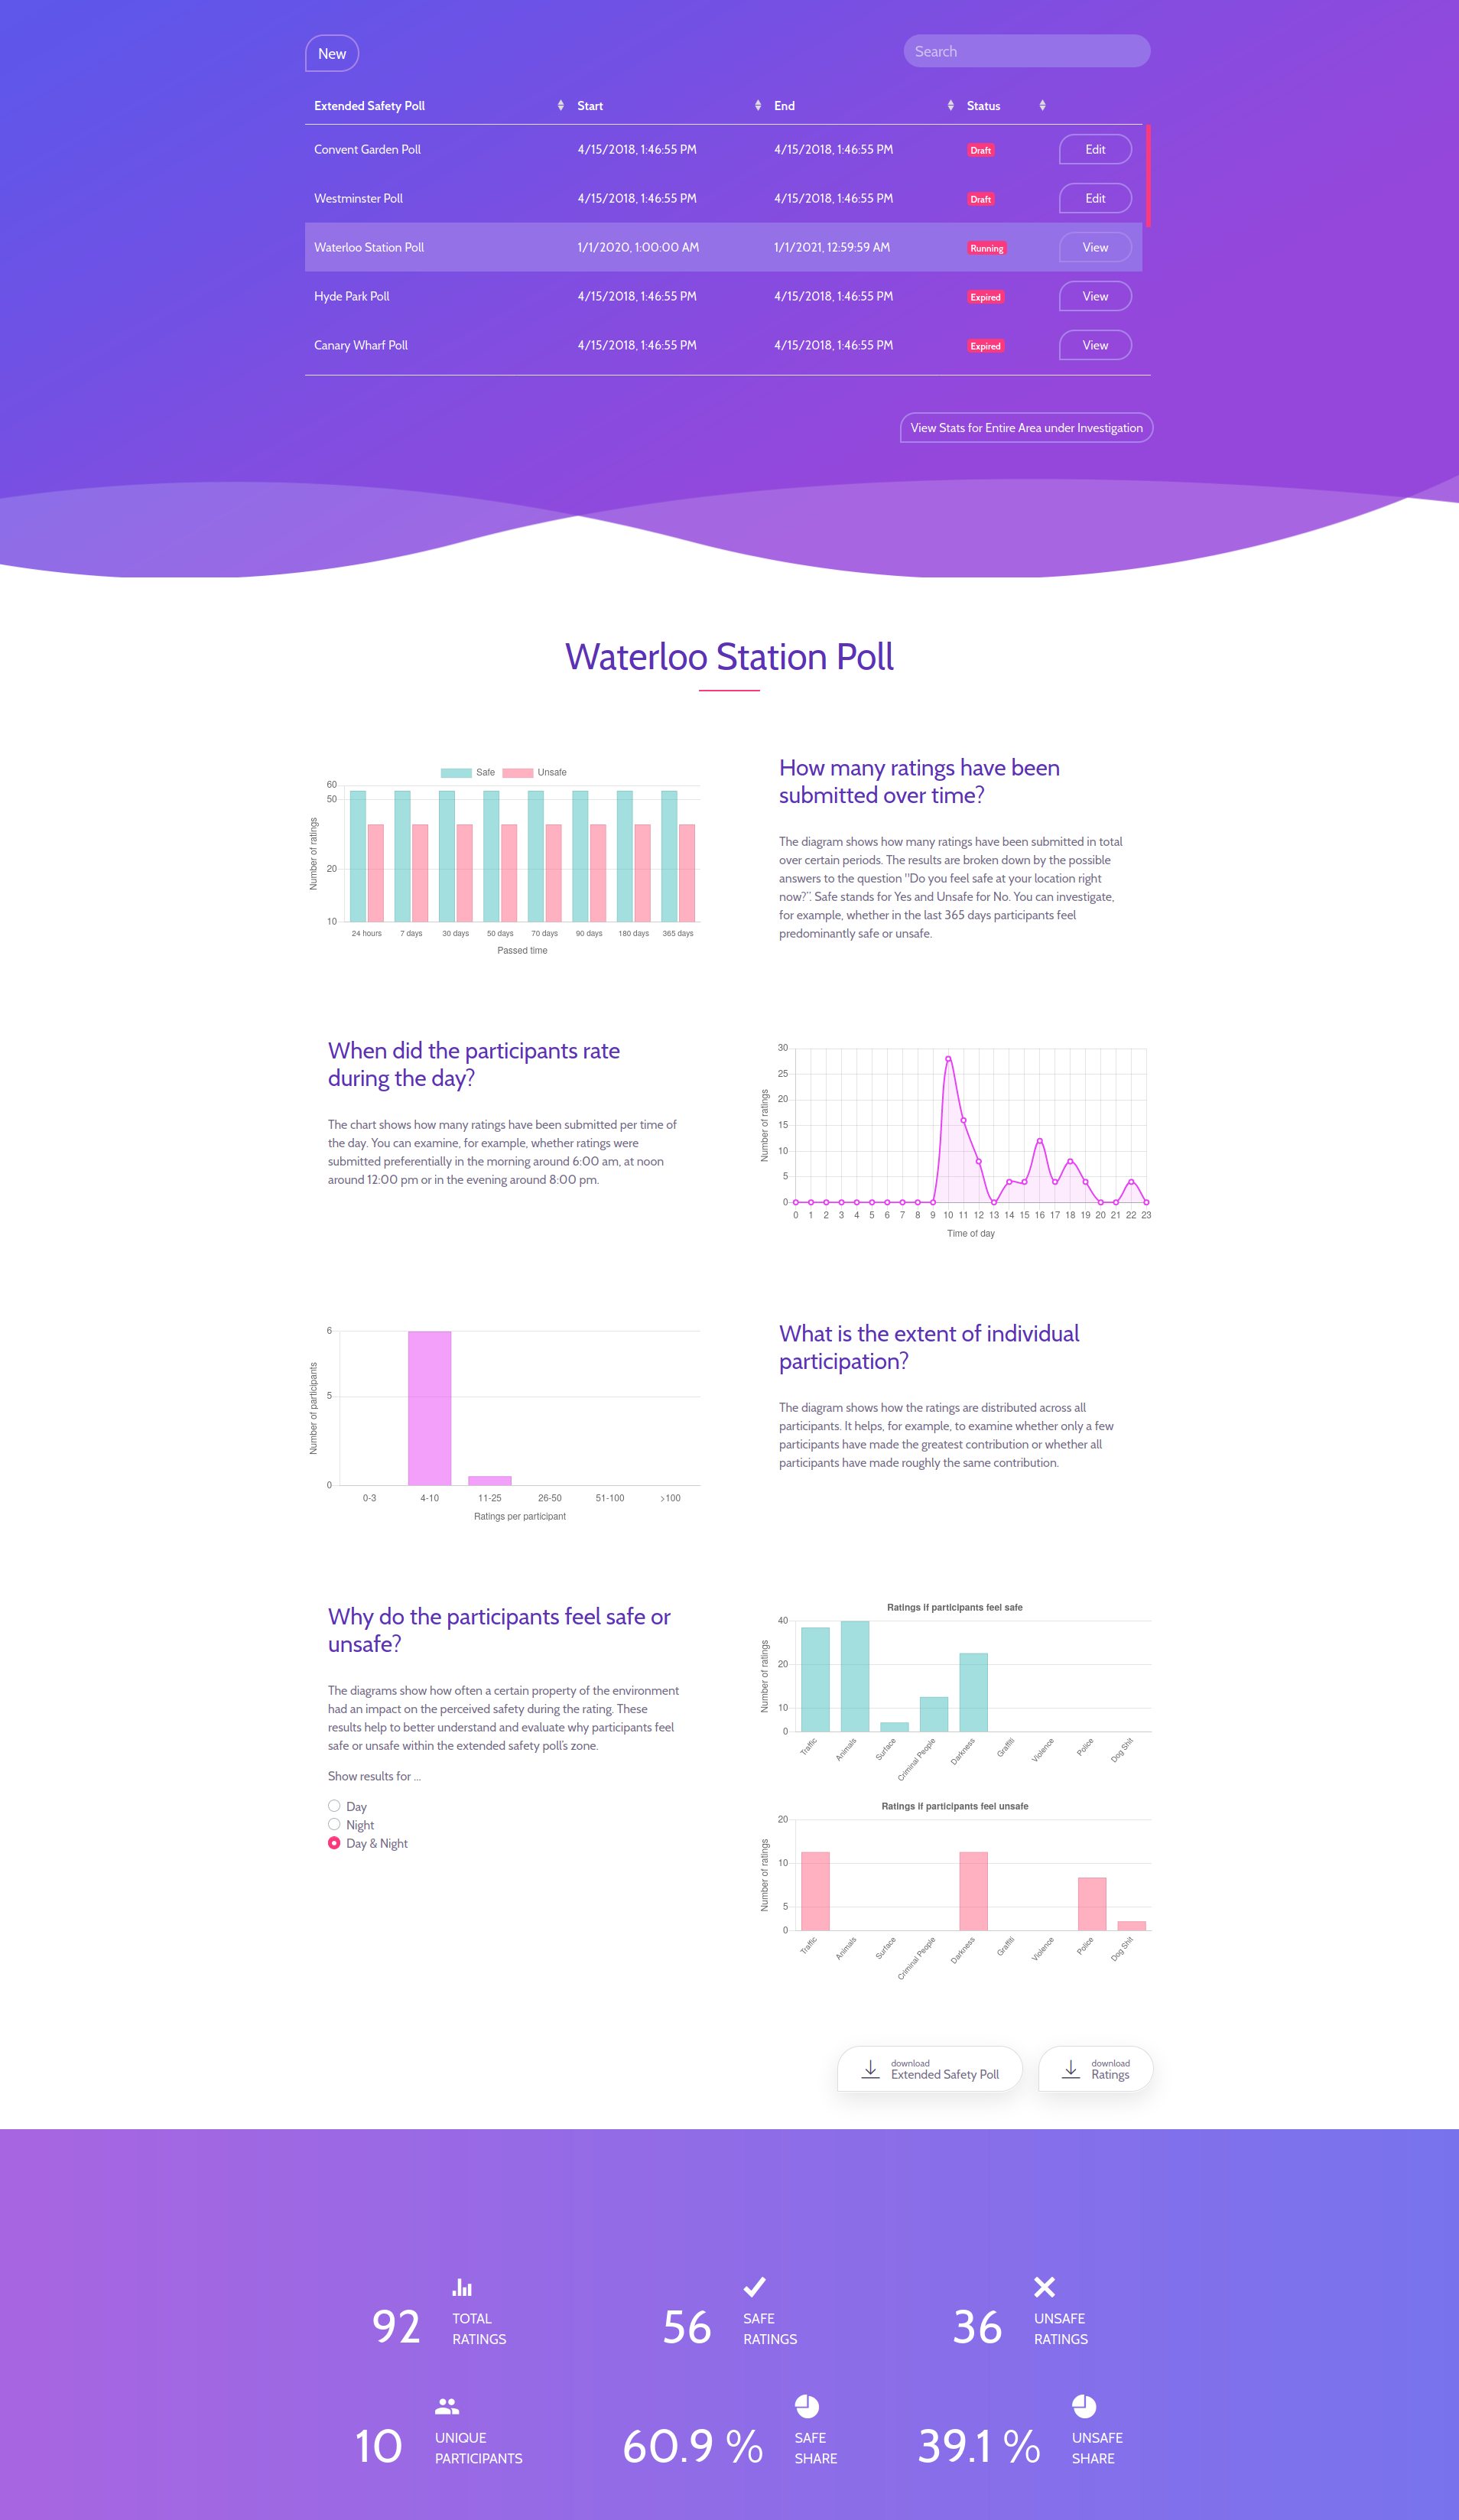
To do so, local research partners are granted exclusive access to the Sensafety dashboard. It allows local research partners to view live statistics, download ratings and to manage extended safety polls for a particular area of investigation.

Examples of live statistics are the number of unique participants, the average number of ratings per participant or the temporal distribution of ratings over a day. All ratings for the area of investigation can be downloaded via the dashboard in raw format (JSON) for further analysis,. A rating encompasses the time a rating was submitted, the exact geographical position - with estimated accuracy - at which the rating was submitted, the rating itself and, if available, the results of an extended safety poll. Ratings are fully anonymized and do not contain any personal data or device identifiers.

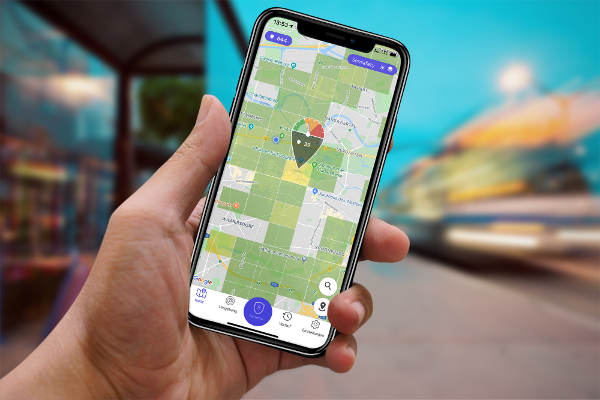
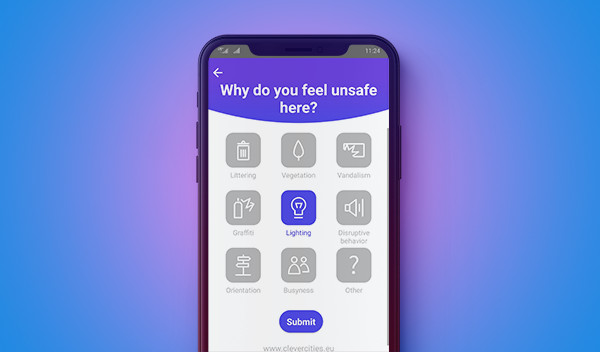
With the Sensafety App, the perceived safety is captured by prompting the participant with a simple question: "Do you feel safe at your location right now?". For the answer, participants can only choose between Yes and No. To give the ratings more meaning, the safety poll can be extended by local research partners for a particular area of investigation. A customized extended safety poll is highly location-dependent and is only shown to participants within the local research partner's area of investigation. The extended safety poll asks the participants, in addition to the simple question, to select from a list of local factors that lead to the personal assessment, e.g. lighting or littering situation. Local research partners are free to decide which location-specific factors should be listed within a customized extended safety poll for their area of investigation.

Interested? Just contact us, tell us how you would like to use Sensafety in your research project and become a local research partner of the Sensafety initiative.